Administrative Reporting
The Reporting area contains comprehensive Administrative Reports and Teacher Reports. Teacher Reports offer granular, student-level data for progress monitoring and intervention. Administrative Reports provide aggregate district, school, and group-level data to support compliance and help administrators identify sites that need more support.
How to Access Admin Reporting
Log in to Language Tree Online. From the homepage, scroll down and click on the Reporting block.

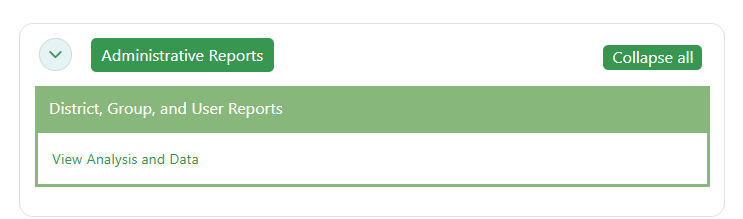
Click on the View Analysis and Data link to access the Administrative Reports.
Note: The view for both types of reporting will vary by role. Administrators can view data across all sites, but teachers can only see the data for their class.
At the top of the page, a date selection filter and global usage metrics are displayed. Use the drop-down menu to select the time period for the data on this page (default: To-Date).
The metrics shown will reflect the selected period and will vary by role. Teachers will see data for their class only, while administrators will see data for all students on the platform.

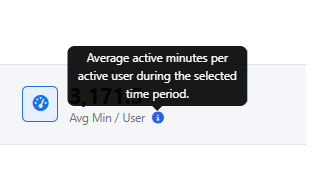
If you want more information on any metric or table header, hover over the (i) information icon.
Assessments Tab
The first tab you will see is the Assessments tab. This tab contains aggregate assessment score summaries and assessment completion data for ELD1, ELD2, and the Performance Indicator.
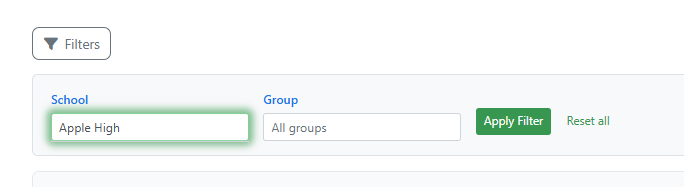
For admin viewers, the data will default to include all students enrolled in the Language Tree Online program. You may narrow the analysis to a particular school or site/class by clicking on the Filters button, typing in the search term, and then Apply Filter. Click Reset all to return to the default.
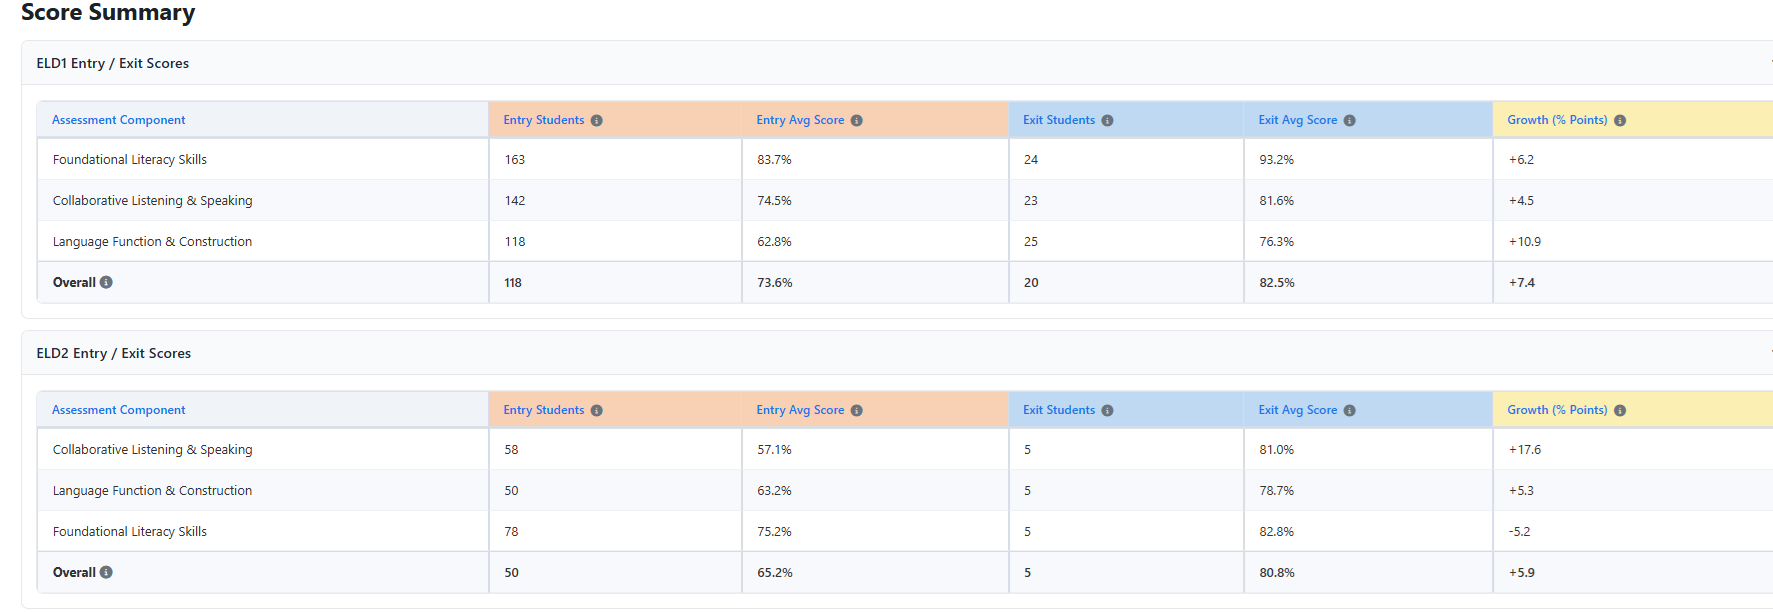
The first set of tables displays Entry/Exit assessment score data for ELD1 and ELD2. Note: The summary score assessment table is visible only when one or more students have submitted an assessment.
Data includes the number of students who took each assessment, the average Entry and Exit scores across all assessments, and the average growth* between the two. If the Performance Indicator was purchased, an additional table shows average domain and overall scores.
*The metric "Growth" reflects the average growth of a typical student and only includes students who completed both the Entry and Exit assessments.
The second set of tables shows completion of the assessments by site or school. Click on the caret (>) next to the school name to expand and view any classes or groups that roll up under the site. During the assessment window, monitor to ensure each site completes all 3 parts of the Entry/Exit assessments or all 4 domains of the Performance Indicator.

Lessons Tab
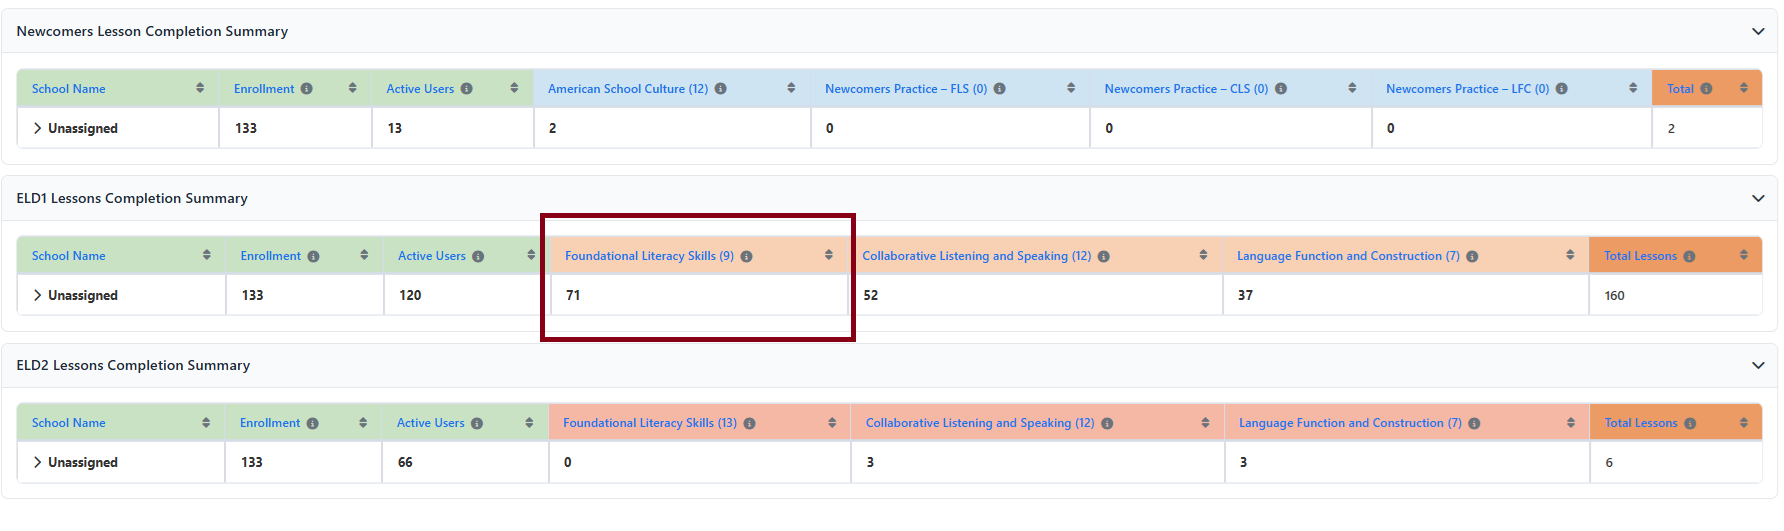
The middle tab is the Lessons tab, which displays the number of students who completed each lesson module in Newcomers, ELD1, and ELD2. Similar to the previous tab, the default is to show all students, but you can narrow by filtering by School or Group/Class,
In the example below, we see that 71 students completed all 9 lessons of the ELD1 Foundational Literacy Skills module during the selected time period.
Note: Compare completed modules against Active Users rather than Enrollment, as students may be enrolled in all three levels (Newcomers, ELD1, ELD2) but typically focus on one.
User Tab
The User tab displays individual student progress and usage data. By default, administrators see all enrolled students. Teachers will only see the students in their classes. Use the filters to narrow results by student name, school, or group. Click Reset All to return to the default view.

The table contains multiple columns. Scroll right using the bottom scroll bar to view all columns, or hide unneeded columns by unchecking the box(es).
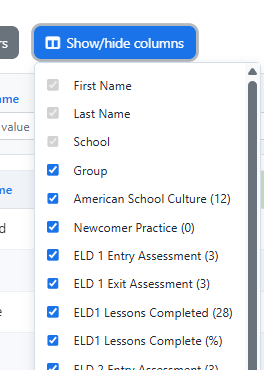
The User tab includes: number of assessments completed, number of lessons completed in each module, percentage of total lessons completed in module, active time spent, and last time any course was accessed.
Goal Tracking Tab
The last tab is a leaderboard that shows the ranking of sites or schools by program usage. The first table lists the "Top 10" sites, and the second table lists the "Bottom 10" sites. If Language Tree is only used at one site, this tab will not be relevant.
This information helps administrators determine which sites are making adequate progress in the program and which may require more support.

Note: Ranking is based on the average number of lessons completed by active users, so that the size of the school does not affect the ranking. Administrators should also ensure the number of active users at each site is adequate.
Exporting Reports
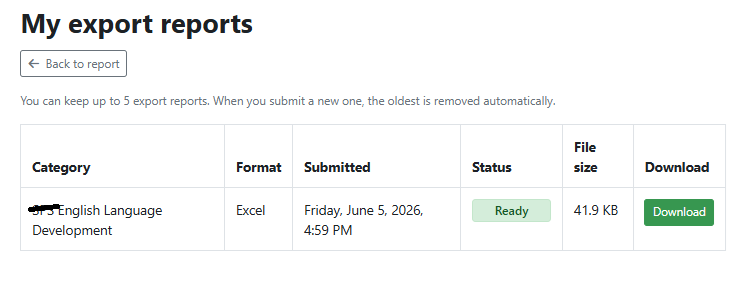
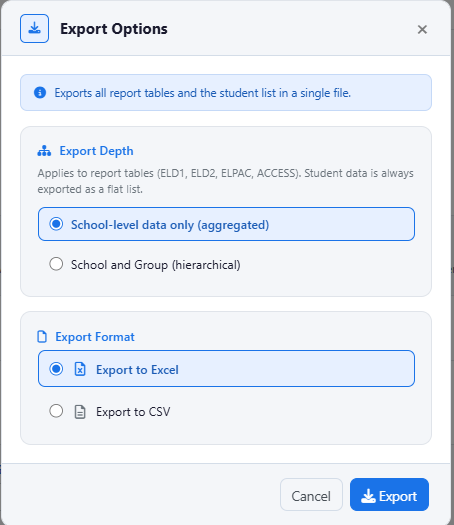
To export the report, which includes data for all the tabs, click on the Export button on the upper right-hand side of the page.
Note: Exports will match the filtered data view. Be sure to reset filters if you want to see a report with all data.

The default is School-level data, but you may choose to export and show both School-level and Group-level data.
User data includes: number of assessments completed, number of lessons completed, % of total lessons completed, active time spent, and last time any course was accessed.